Lemmatization and Stemming using spaCy
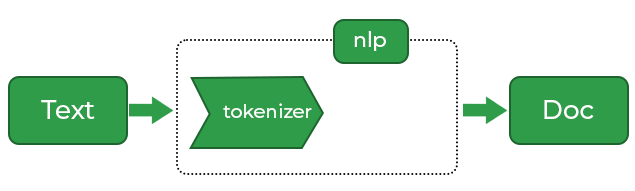
Words and Sentences Tokenization using spaCy
Python scripts for radiation calculations
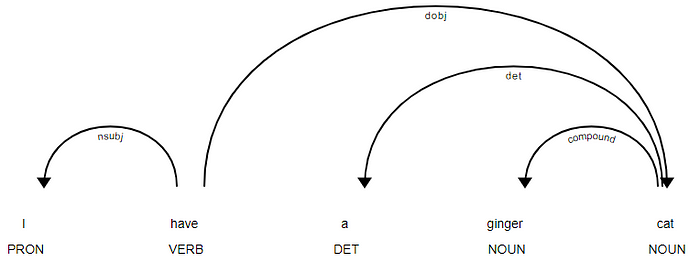
Getting Started with spaCy
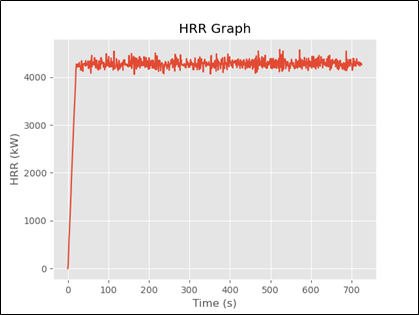
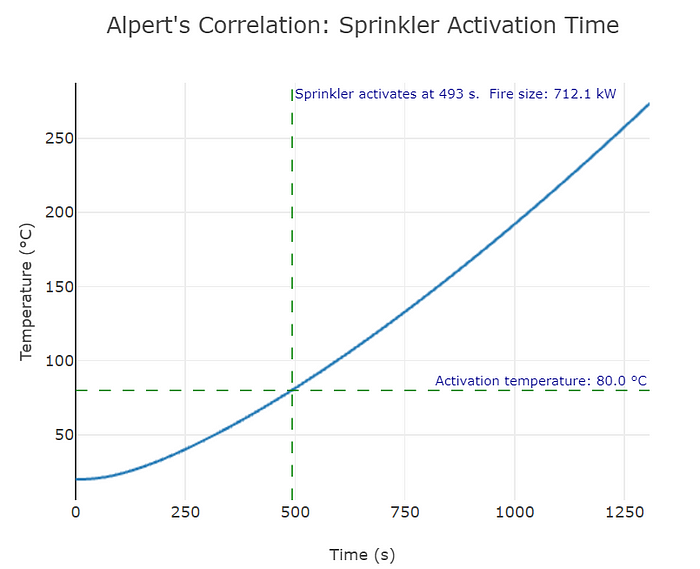
Real-Time Animation of HRR Graph using FuncAnimation in Matplotlib
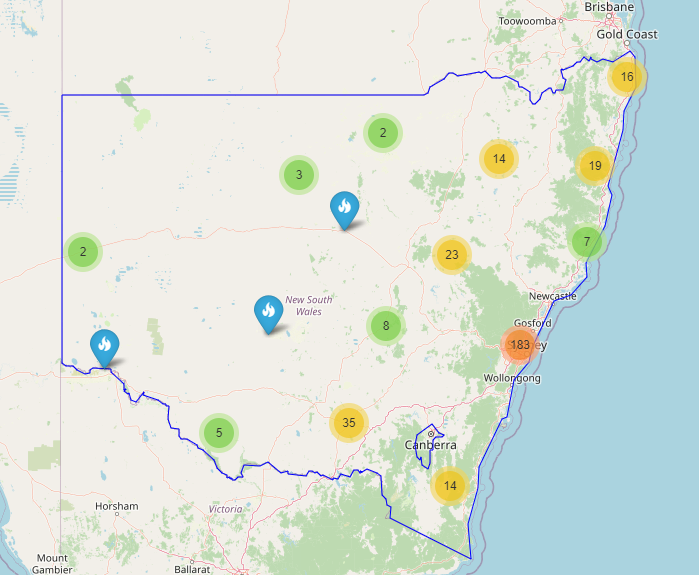
Locating all the Fire & Rescue New South Wales (FRNSW) fire stations on a map
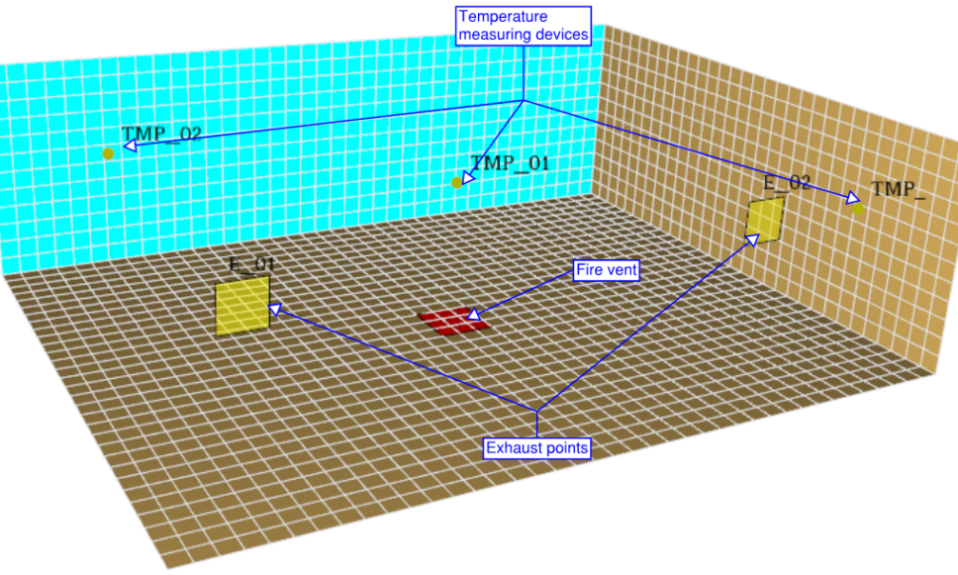
Generating Graphs Using Device Data from FDS
