This article will look at how to extract fire location-specific information from the Fire and Rescue New South Wales (FRNSW) website using the BeautifulSoup package. The data extracted is used to generate a map with all the station locations on an HTML page.
Map of all fire station locations is here: https://jabirjamal.com/frnsw-stations/
You can also check out all the MFB fire station locations here (CFA not included): https://jabirjamal.com/mfb–stations/
The FRNSW stations are zoned based on geographical location, and each zone has their individual web pages. A Python script is used to extract the complete list of FRNSW fire station names and addresses located on multiple web pages.
Web scraping using BeautifulSoup
To get started, we need to determine the base URL. In this case, the base URL is as below:
url_base = ‘https://www.fire.nsw.gov.au/page.php?id=9231&zone='Next, I have created a list that includes all the zones or the suffix required to be appended to the url_base to generate the URL for the individual zones.
zones = ['ME1', 'ME2', 'ME3', 'MW1', 'MW2', 'MW3', 'MN1', 'MN2', 'MN3', 'MS1', 'MS2', 'MS3', 'RW1', 'RW2', 'RW3', 'RN1', 'RN2', 'RN3', 'RS1', 'RS2', 'RS3']Now we will look at the main code to scrape the website.
sta = []
add = []
for zone in zones:
    url = url_base + zone
    response = requests.get(url)
    soup = BeautifulSoup(response.text, 'lxml')
    tags = soup.find_all('div', class_ = "card-content")
    station = []
    address = []
    for tag in tags:
        station.append(tag.span.text)
        address.append(tag.p.text)
    sta.append(station)
    add.append(address)
A new list ‘all_stations’ is created to flatten the nested list ‘sta’. Similarly, the ‘add_address’ list is created to store the flattened the nested list ‘sta’
all_address = []
for addresses in add:
    for address in addresses:
        all_address.append(address)

all_stations = []
for stations in sta:
    for station in stations:
        all_stations.append(station)
Converting the lists to a DataFrame
To create a DataFrame, we will first assign the newly created list to pd.DataFrame and assign column name as ‘station’. We will also add a column that contains the station addresses.
df = pd.DataFrame(all_stations,columns=['Stations'])
df['Address'] = all_address
df.head(10)
Using GoogleMaps API to idenfity station longitude and latitude
Head over to https://developers.google.com/maps to get your GoogleMaps API key. To get you started with development using GoogleMaps, Google provides you with $300 free credit, which can be used to access the API.
Once you have generated your API key, follow the steps below to generate the latitude and longitudinal values for each station addresses provided in the DataFrame. The geographical coordinates are saved to the DataFrame in separate columns.
api_key = 'your-API-keys-from-GoogleMaps'

for i, row in df.iterrows():
    address = str(df.at[i,'Address'])
    encoded_address = urllib.parse.quote(address)
    response = requests.get('https://maps.googleapis.com/maps/api/geocode/json?address='+encoded_address+'&key='+api_key)
    resp_json = response.json()
    lat = (resp_json['results'][0]['geometry']['location']['lat'])
    lng = (resp_json['results'][0]['geometry']['location']['lng'])
    df.at[i,'lat'] = lat
    df.at[i,'lng'] = lng

df.head()
The output from the above code is given below:

Using Folium to locate the address on the map
A third-party package, Folium, is used in this article to generate the map. Parameters are initialised to focus on NSW when the map is loaded. Also, each marker on the map will highlight the station name and address. Refer to the following code:
m = folium.Map(location = [-33.8, 151.2], tiles ='OpenStreetMap', zoom_start=6)
for i, row in df.iterrows():
    lat = df.at[i, 'lat']
    lng = df.at[i, 'lng']

    popup = 'Station : ' + str(df.at[i, 'Stations']) + '<br>' + '<br>' +'Address: ' + df.at[i, 'Address']

    folium.Marker(location = [lat, lng], popup= popup, icon = folium.Icon(color='blue')).add_to(m)

m.save('FRNSW_Locations1.html') fire stations on a map_files/1_wRHEaXroKyu4fyCLgFlucA.png)

The above code is modified to generate the following maps.

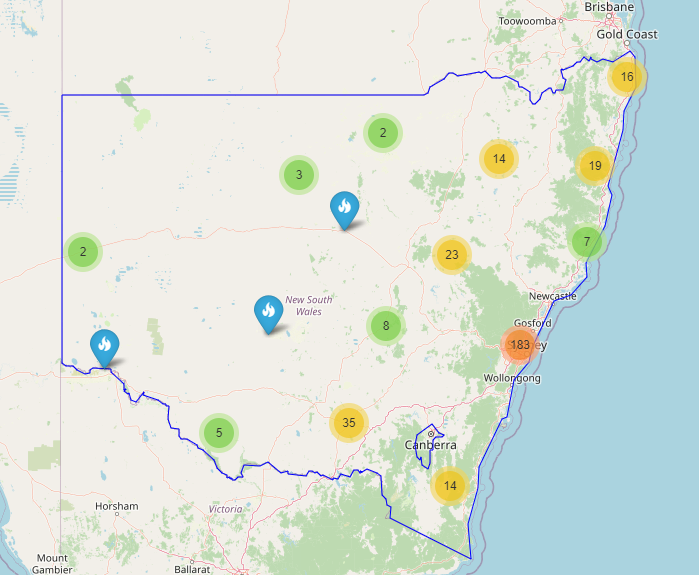
In the map below, NSW state coordinates in json format is used to highlight the state boundary.

You can read this article with additional information on my Medium page: https://jabirjamal.medium.com/
GitHub
You can find a modified version of the script used in this article on my GitHub repository here: https://github.com/jabirjamal/jabirjamal.com/tree/main/FE/FE_05